How To Keep a Resolution
February 4, 2024
Connecting the Cost of Living to the Minimum Wage
February 6, 2024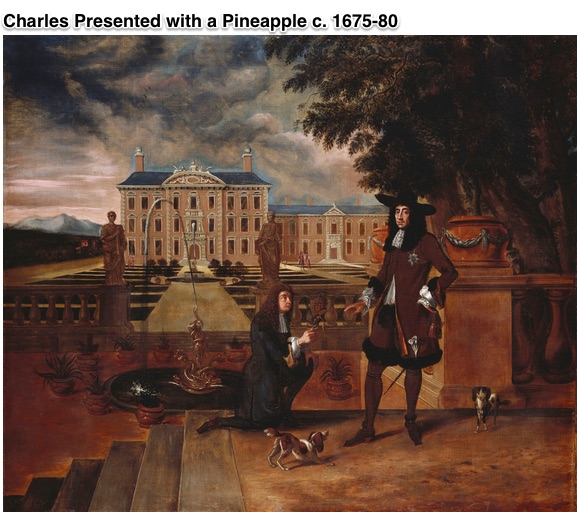
Looking at global inequality, Tom Standage’s An Edible History of Humanity takes us back before we move forward.
Some Edible History
Ancient hunter-gatherer groups had to be egalitarian. With sharing the best way to guarantee a daily supply of food, the best hunter was a modest hunter. When no one was jealous of anyone, they could work together. Accumulating food and material goods was pointless. Knowing they would move on once the local food supply was exhausted, families possessed little more than the tools they needed to survive. Economic inequality was impractical.
By contrast, agriculture and a sedentary lifestyle generated income differences. Once farmers could produce a surplus, urbanization became feasible. And once we urbanized, we stratified and specialized far beyond the hunter-gatherers’ division of labor. In Mesopotamia, “The Standard Professions List,” written in cuneiform script on clay tablets from 3200 B.C., included 129 professions with “supreme judge,” mayor and sage at the top. Even the social complexity that characterized Egypt’s pyramids or Mesopotamia’s ziggurats could be traced back to agricultural surpluses.
My favorite fact, though, was about a portrait of England’s King Charles II (our featured image). Painted towards the end of the 17th century, the painting shows the King’s gardener on his knees offering Charles a pineapple. Yes, we also see the King’s elaborate dress, his two spaniels, his estate. But it was the pineapple that made the difference. Rare and distantly grown, its very presence signified the King’s status, his elite taste, and inequality.
Billionaire Wealth
Rather like King Charles’s pineapple, now, we have Oxfam International telling us that 62 people possess as much wealth as one half of the world’s population.
Their goal was to show us that too much of the world’s wealth is concentrated among a small number of people.
However, gauging iwealth can be complicated.
Calculation Questions
According to a new Oxfam inequality report, “the world’s five richest men have more than doubled their fortunes from $405 billion to $869 billion since 2020…”
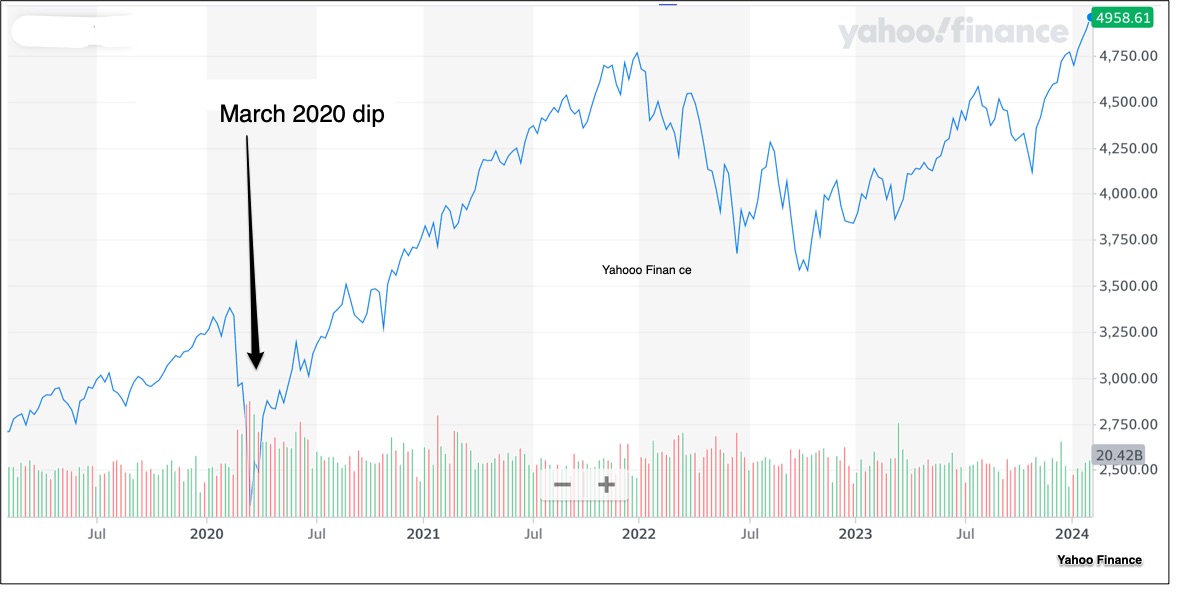
When we decide if a fortune has doubled, the starting date matters. By choosing March 2020, we are looking at a Dow dip, after which the averages rose. Choosing a different date, like 2022, takes us to market highs that make future increases less impressive:
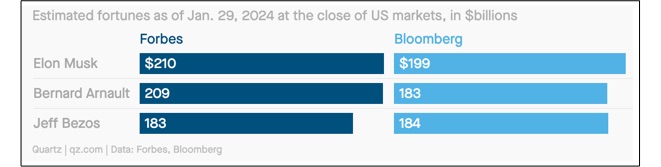
We also have the Forbes and Bloomberg Billionaire ranks disagreeing:
In addition, markets perpetually shift values during the trading day. Some time(s) on Friday, 2/1/24, Arnault & Family were #1 and Musk, #2:
Then, looking more closely, you can see that Elon Musk’s Tesla stock skyrocketed his wealth:
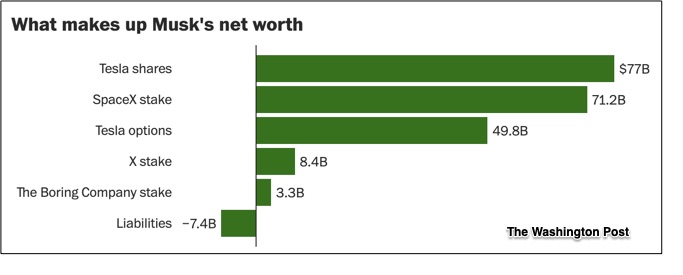
Whether for billionaires or everyone else, wealth is not necessarily the most accurate way to gauge inequality. Judging wealth, it can be tough to decide what to include, how to evaluate it, and how to access it. Adding that wealth numbers can be misleading, economist Tim Harford points out in his More or Less podcast that a farmer’s shack in a poorer nation is a plus while a doctor’s debt in a more affluent country is a minus.
Instead, he takes listeners to income.
Our Bottom Line: Global Income Inequality
Among the slew of income numbers at Our World in Data, they looked at the impact of income redistribution. Using Gini coefficients (lower means more equal), they compared countries:
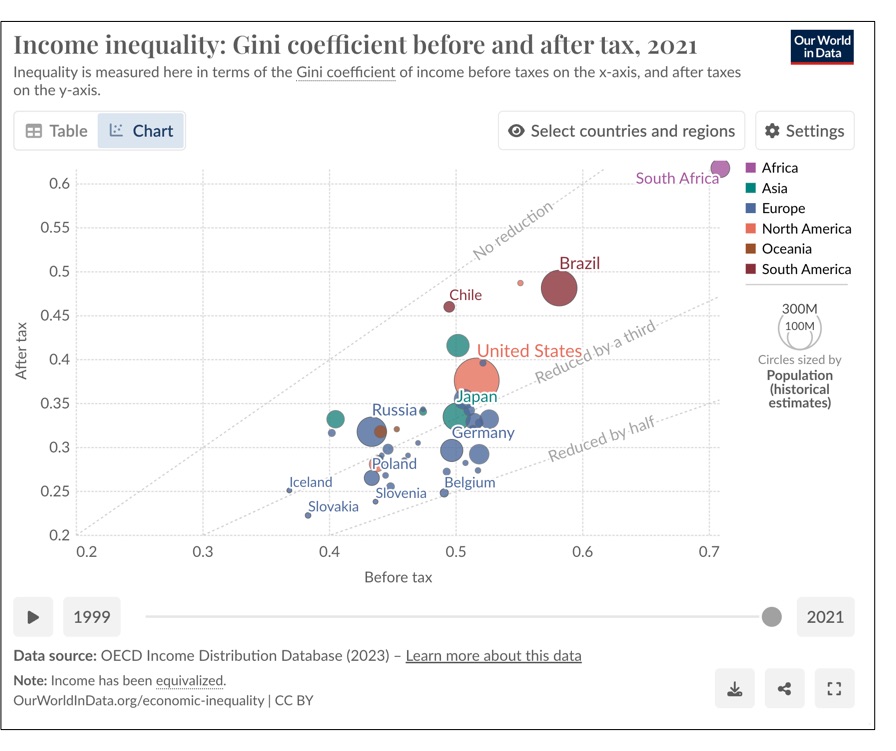
Where are we? While the most affluent have a huge amount of wealth, we need to focus on so much more. If you go to just one other source beyond econlife, do head for Our World in Data.
My sources and more: Thanks to Tim Harford’s More or Less podcast for inspiring today’s post. From there, the countless ways to look at inequality were in this Oxfam report, at Our World in Data, and in the Credit Suisse Global Wealth Report. I also found it helpful to evaluate the contributions made by billionaires as shown by The Washington Post.